US Crime Rates & City Safety Directory
Select a state to compare 2026 population-adjusted safety scores, crime rates per 100,000, source years, and reporting coverage for published city profiles.
Jump to section
Data, definitions and reuse
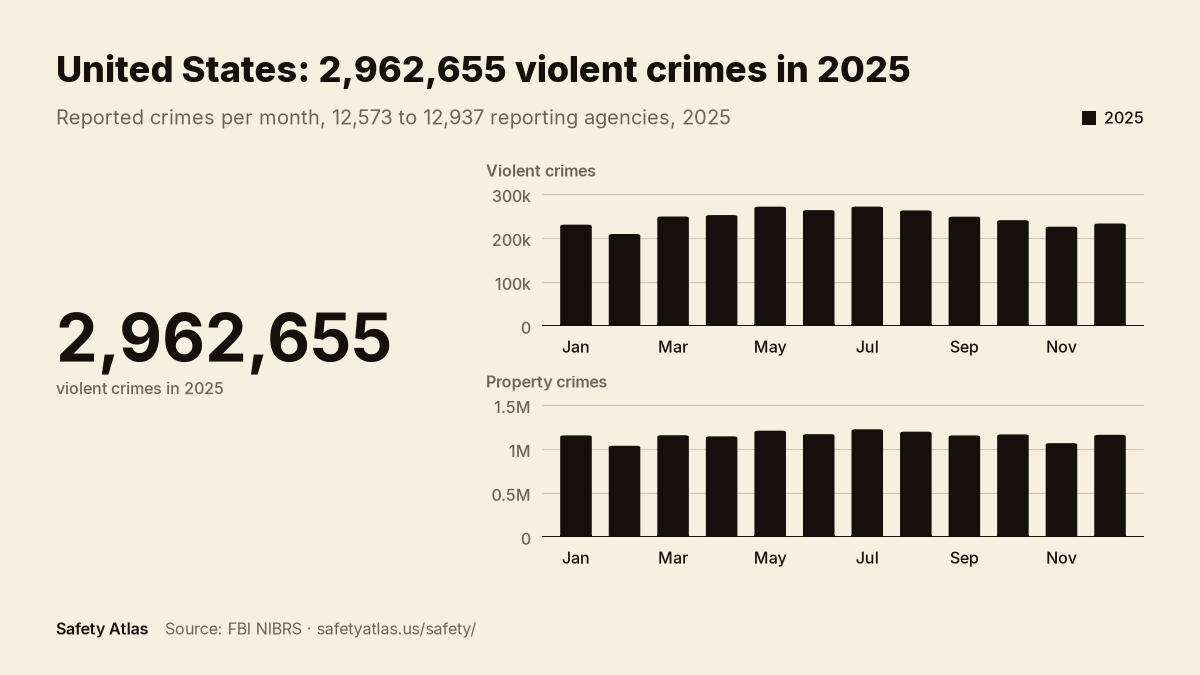
Violent: murder, rape, robbery, aggravated assault. Property: burglary, larceny, vehicle theft, arson. Monthly counts are summed over the agencies that reported each month, and agency coverage changes over time.
| Month | Violent | Property | Agencies reporting |
|---|---|---|---|
| Jan | 230807 | 1156995 | 12937 |
| Feb | 209498 | 1038613 | 12839 |
| Mar | 249326 | 1158915 | 12899 |
| Apr | 252632 | 1145993 | 12876 |
| May | 271778 | 1210909 | 12864 |
| Jun | 263911 | 1170997 | 12830 |
| Jul | 271907 | 1226794 | 12810 |
| Aug | 263221 | 1199689 | 12771 |
| Sep | 248924 | 1156553 | 12734 |
| Oct | 241033 | 1168342 | 12697 |
| Nov | 226168 | 1068640 | 12615 |
| Dec | 233450 | 1163411 | 12573 |
Reuse under CC BY 4.0; indicate changes. Embed code:
<img src="https://www.safetyatlas.us/img/charts/united-states-crime-trend-2025.webp" alt="Chart of United States crime statistics: United States agencies reported 2,962,655 violent offenses in 2025. Between 12,573 to 12,937 agencies reported each month, so the total is not compared with 2024. Shows violent and property offenses per month." width="1200" height="675" loading="lazy" style="max-width:100%;height:auto">
<p>Source: <a href="https://www.safetyatlas.us/safety/">Safety Atlas, United States</a>. <a href="https://creativecommons.org/licenses/by/4.0/">CC BY 4.0</a>.</p>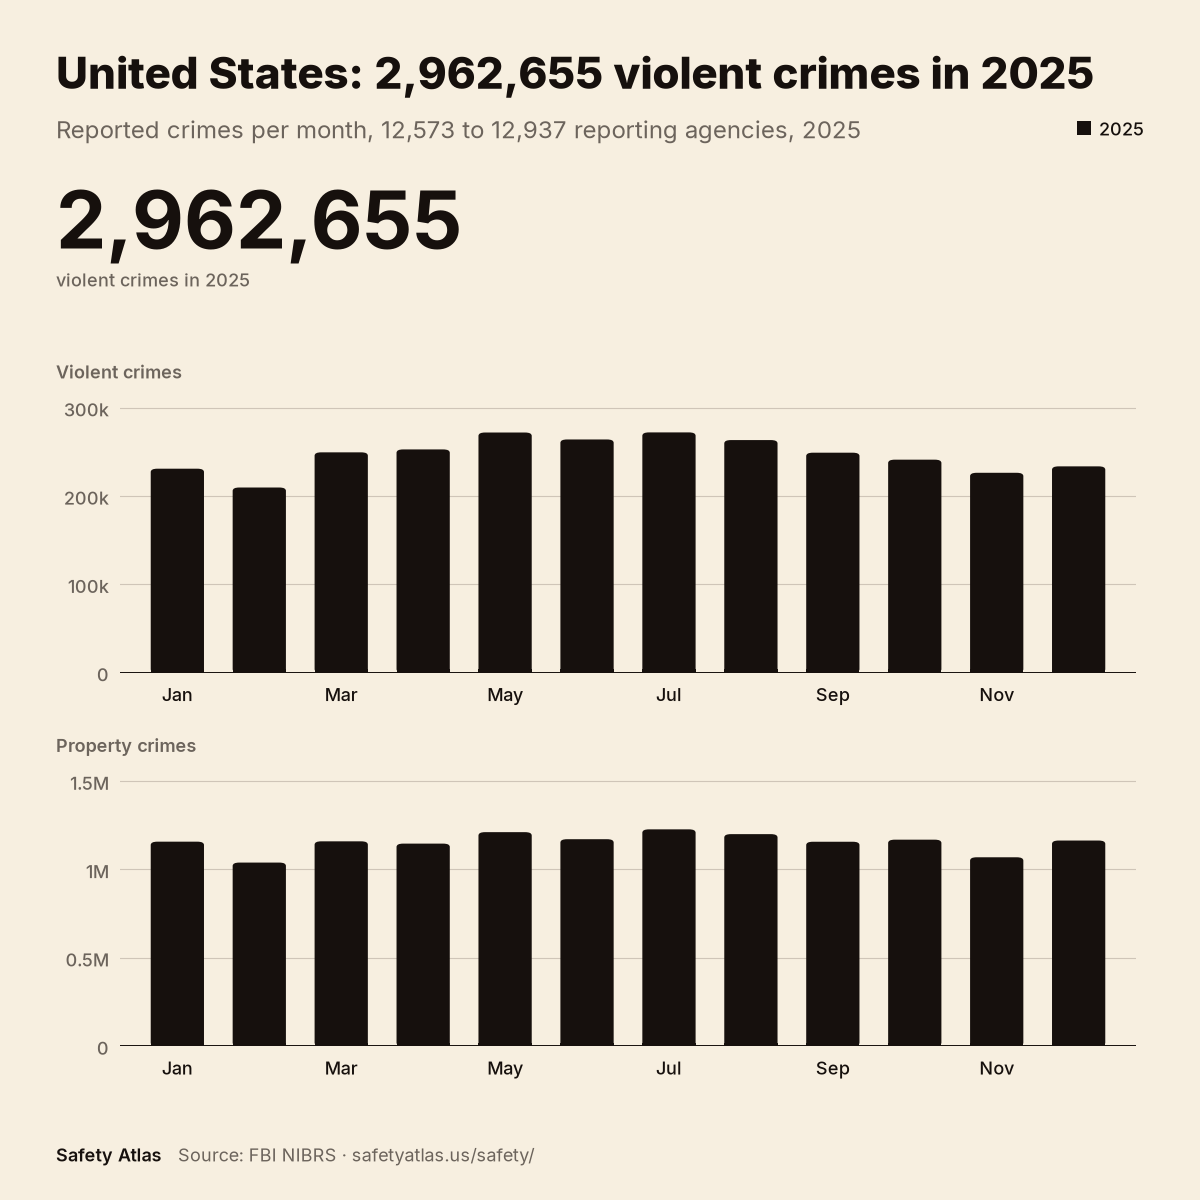
The United States in 7 numbers
- Every major offense fell in 2025. Motor vehicle theft -22% (2,328,099 to 1,813,270), robbery -19%, homicide -17%, burglary -16%, larceny-theft -9%, aggravated assault -8%.
- Almost half of all reports are property crime. 16,512,243 of 36,085,106 reports (45.8%); larceny-theft alone is 10,235,099 (28.4%).
- Clearances skew toward violent crime. 68% of homicides cleared vs 10% of motor vehicle thefts and 17% of burglaries (2025, reports cleared divided by reports received, reporting agencies only).
- Homicides fell by nearly a fifth. 41,268 reports in 2025 vs 50,020 in 2024 (-17%) across reporting agencies.
- Most reports are not violent. Property crime is 45.8% (16,512,243); personal-safety offenses are 8.6% (3,119,006) of all reports.
- Community-order volume dwarfs headlines. Simple assault (6,187,685) plus vandalism (3,816,141) together triple the personal-safety total.
- These are reporting-agency sums. 6,796 of 14,940 agencies reported motor vehicle theft in December 2025 (vs 7,083 in January); totals reflect who reported, not a census of crime.
Takeaways are computed from summed FBI CDE reported counts (source year 2025, 14,940 agencies in file). They describe reported data, not forecasts; check the methodology and coverage notes before reuse.
Work with the full file
Every number on this page ships in the national workbook.
All 50 states, monthly series 2020-2025 with reporting-agency counts, coverage flags, and methodology notes.
United States monthly trend: reporting-agency sums through December 2025
Annual totals hide timing. The bars below show 2025 reported counts per month, summed across agencies that reported each month, for three indicator offenses; each table carries the same numbers with reporting-agency counts. The full 20-offense monthly series (2020-2025) is downloadable below.
Motor Vehicle Theft, month by month
↓ Decreasing, 1,813,270 reports vs 2,328,099 in 2024 (down 22% in reported data).
| Month | Count | Agencies | Coverage |
|---|---|---|---|
| Jan 2025 | 160,648 | 7,083 | Full |
| Feb 2025 | 140,876 | 7,017 | Full |
| Mar 2025 | 155,404 | 7,052 | Full |
| Apr 2025 | 150,819 | 7,037 | Full |
| May 2025 | 162,367 | 7,033 | Full |
| Jun 2025 | 158,766 | 7,010 | Full |
| Jul 2025 | 166,635 | 6,995 | Full |
| Aug 2025 | 156,719 | 6,955 | Full |
| Sep 2025 | 144,753 | 6,936 | Full |
| Oct 2025 | 145,592 | 6,906 | Full |
| Nov 2025 | 133,827 | 6,842 | Full |
| Dec 2025 | 136,864 | 6,796 | Full |
Burglary, month by month
↓ Decreasing, 1,732,373 reports vs 2,062,269 in 2024 (down 16% in reported data).
| Month | Count | Agencies | Coverage |
|---|---|---|---|
| Jan 2025 | 149,344 | 7,195 | Full |
| Feb 2025 | 131,979 | 7,117 | Full |
| Mar 2025 | 145,733 | 7,156 | Full |
| Apr 2025 | 143,758 | 7,138 | Full |
| May 2025 | 151,332 | 7,141 | Full |
| Jun 2025 | 144,883 | 7,114 | Full |
| Jul 2025 | 152,850 | 7,101 | Full |
| Aug 2025 | 149,236 | 7,062 | Full |
| Sep 2025 | 144,722 | 7,042 | Full |
| Oct 2025 | 144,400 | 7,010 | Full |
| Nov 2025 | 132,906 | 6,951 | Full |
| Dec 2025 | 141,230 | 6,898 | Full |
Robbery, month by month
↓ Decreasing, 461,363 reports vs 567,676 in 2024 (down 19% in reported data).
| Month | Count | Agencies | Coverage |
|---|---|---|---|
| Jan 2025 | 40,249 | 7,385 | Full |
| Feb 2025 | 34,362 | 7,308 | Full |
| Mar 2025 | 36,834 | 7,349 | Full |
| Apr 2025 | 37,946 | 7,328 | Full |
| May 2025 | 42,123 | 7,332 | Full |
| Jun 2025 | 39,873 | 7,302 | Full |
| Jul 2025 | 41,230 | 7,293 | Full |
| Aug 2025 | 40,625 | 7,251 | Full |
| Sep 2025 | 38,554 | 7,230 | Full |
| Oct 2025 | 38,170 | 7,199 | Full |
| Nov 2025 | 35,290 | 7,144 | Full |
| Dec 2025 | 36,107 | 7,091 | Full |
Clearances: what got cleared in 2025
68% of homicides cleared vs 10% of motor vehicle thefts, across reporting agencies.
| Offense | Reported | Cleared | Clearance rate |
|---|---|---|---|
| Homicide | 41,268 | 28,077 | 68.0% |
| Aggravated Assault | 2,138,481 | 1,115,428 | 52.2% |
| Robbery | 461,363 | 165,127 | 35.8% |
| Larceny-theft | 10,235,099 | 1,860,516 | 18.2% |
| Burglary | 1,732,373 | 299,677 | 17.3% |
| Motor Vehicle Theft | 1,813,270 | 185,274 | 10.2% |
Clearance counts are reports cleared divided by reports received in 2025 across reporting agencies; a clearance can relate to an earlier report, so this is a workload snapshot, not a solve-rate guarantee.
Nationwide sums add reported counts from agencies that reported each month (roughly 6,800 of 14,940 agencies; late months lag as submissions arrive). No per-100,000 rates are shown: no valid monthly denominator exists at aggregate grain. A hyphen (-) means not reported, not zero. Annual totals equal the sum of shown months within plus or minus 2% (see manifest).
Downloads: United States monthly series (JSON) · same data (CSV) · build manifest
Popular 2026 city safety guides
Start with city reports readers are already finding in search. Each page includes a direct answer, comparison-set rank, offense rates, source year, coverage notes, and scored peers.
Browse safety by state
About the Safety Atlas Rankings
The Safety Atlas Index normalized raw crime observations using a logarithmic relief factor, which prevents small jurisdictions from skewing indexes off single incidents.
We separate violent, property, and community order indicators to ensure that localized incidents do not mask broader threat signals. Read the full details of our data processing in the Methodology Section.
If you searched for a US safety index or a crime index for the USA, this directory is that reference: the Safety Atlas Index scores every published state and city on the same 0 to 100 scale, where 100 means no reported crime and 50 sits near the national average. Each score links to its city or state page with the underlying FBI offense rates.
For the state-level verdict, see our safest states ranking: which states show the lowest crime rates in the 2026 edition is answered in What is the safest state?